Introduction
Recently, I’ve been interested in developing ways to assess my own performance as an outdoor rock climber. One classic tool for evaluating a climber’s history on routes is called the ‘pyramid’ (also known as the ‘scorecard’ on other sites). In this post I discuss how I built a simple web app to illustrate my own climbing pyramid as well as that of any other climber who uses MountainProject.com to track their outdoor climbing performance.
Motivation
I’ve been using Mountain Project meticulously since I began outdoor rock climbing in 2019. On most of my climbing trips, I log ascents in the iPhone app, which syncs with my profile online. This has generally been something I treated as a personal journalling exercise, and I figured I would someday want to look back on my ascents to see how far I’ve come in the sport/adventure of rock climbing.
Recently, I’ve been focused on physical training to improve my climbing performance outside, and the data that I’ve gathered over the past five years would seem to be an invaluable asset. It turns out that I’m not alone, and many other climbers use the same features on Mountain Project to log their ascents, also known as ‘ticks’ on the site

There remains a challenge in leveraging this data, though, which is that metrics of historical climbing performance are not very quantifiable – and those that are quantitative are generally not sophisticated, like Max Redpoint Grade, or Hardest Flash. Those who spend a lot of time in climbing gyms will be familiar with these ideas. In essence, these metrics are akin to asking a runner what their best marathon time is, which can tell you a lot about someone’s running ability. However, it tells you less about how they’ve progressed over time and how they’ve spent their effort to arrive at their current performance level. These questions are more nuanced, and in climbing are arguably more important than just knowing someone’s maximum performance.
Climbing Pyramids
One tool that might help climbers address some of the above questions is called the pyramid. The pyrmaid plots the number of successful (and sometimes unsuccessful) ascents of climbs at a particular grade. Without going into too much detail, rock climbs are graded very rigorously1, a little bit like the green/blue/black grading system of ski routes. While being subject to a fair bit of subjectivity, the grade of a rock climb is usually a reliable measure of how difficult that route will be for the average person.
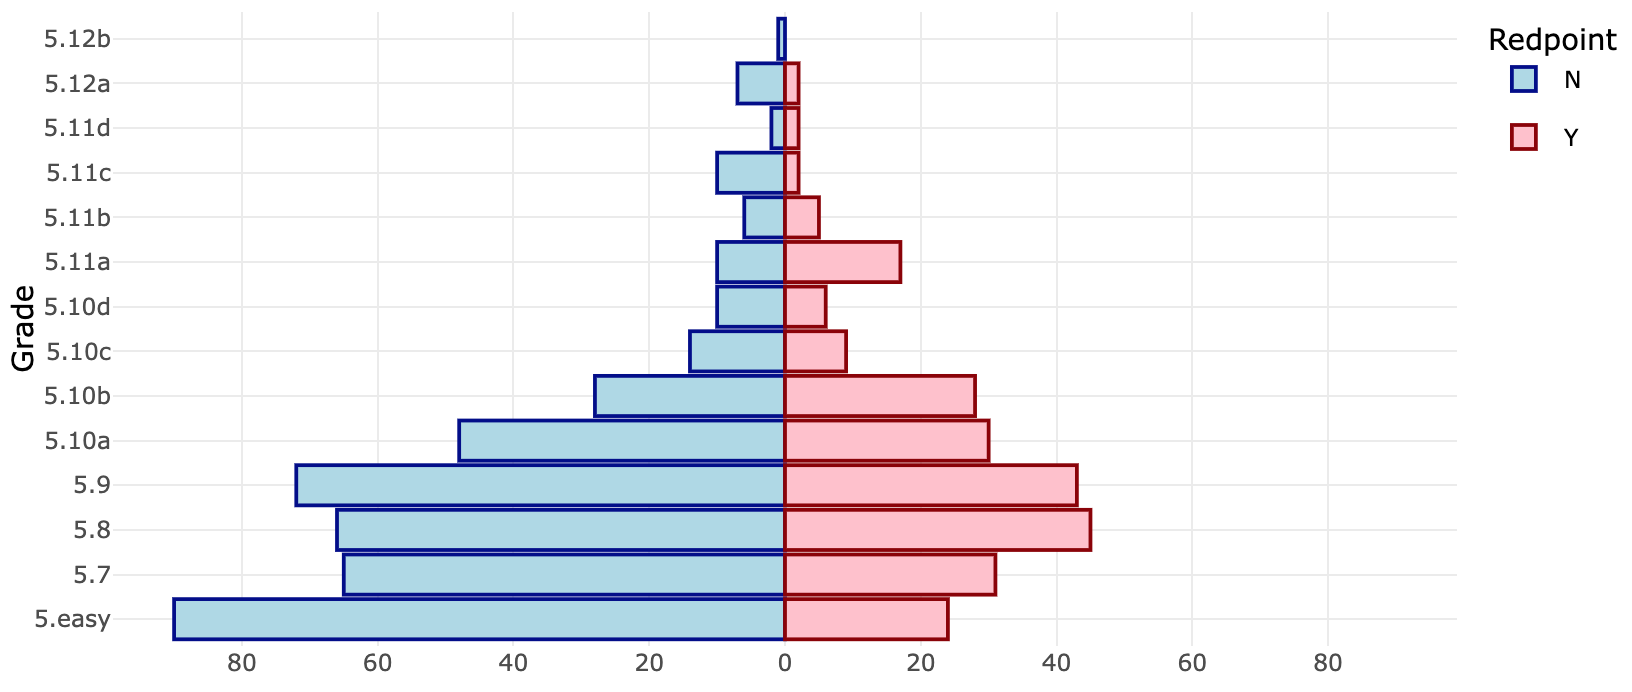
The pyramid tool can help visualize how a climber devotes her finite resources (e.g., time) to climbing routes of a particular grade range. It is a snapshot in time of how well-balanced a climber’s performance is, with a ‘top-heavy’ shape suggesting a climber focuses most of his time on difficult routes, and a ‘bottom-heavy’ shape suggesting he should probably try more difficult routes. There’s a lot of insight to be gained by seeing your own pyramid, and to illustrate an example here is my pyramid as of this writing:

I am no expert but I have an intuition that my climbing pyramid is fairly typical of people at my ability level, with a few unique quirks such as the fact that I’ve spent a lot of time climbing routes at the grade of 5.11a. Additionally, while my max redpoint grade is currently 5.12a, I still have room to reinforce my experience at the grades just below that, namely 5.11c and 5.11d. These are just a few of the takeaways from quickly analyzing my own pyramid.
The Web App
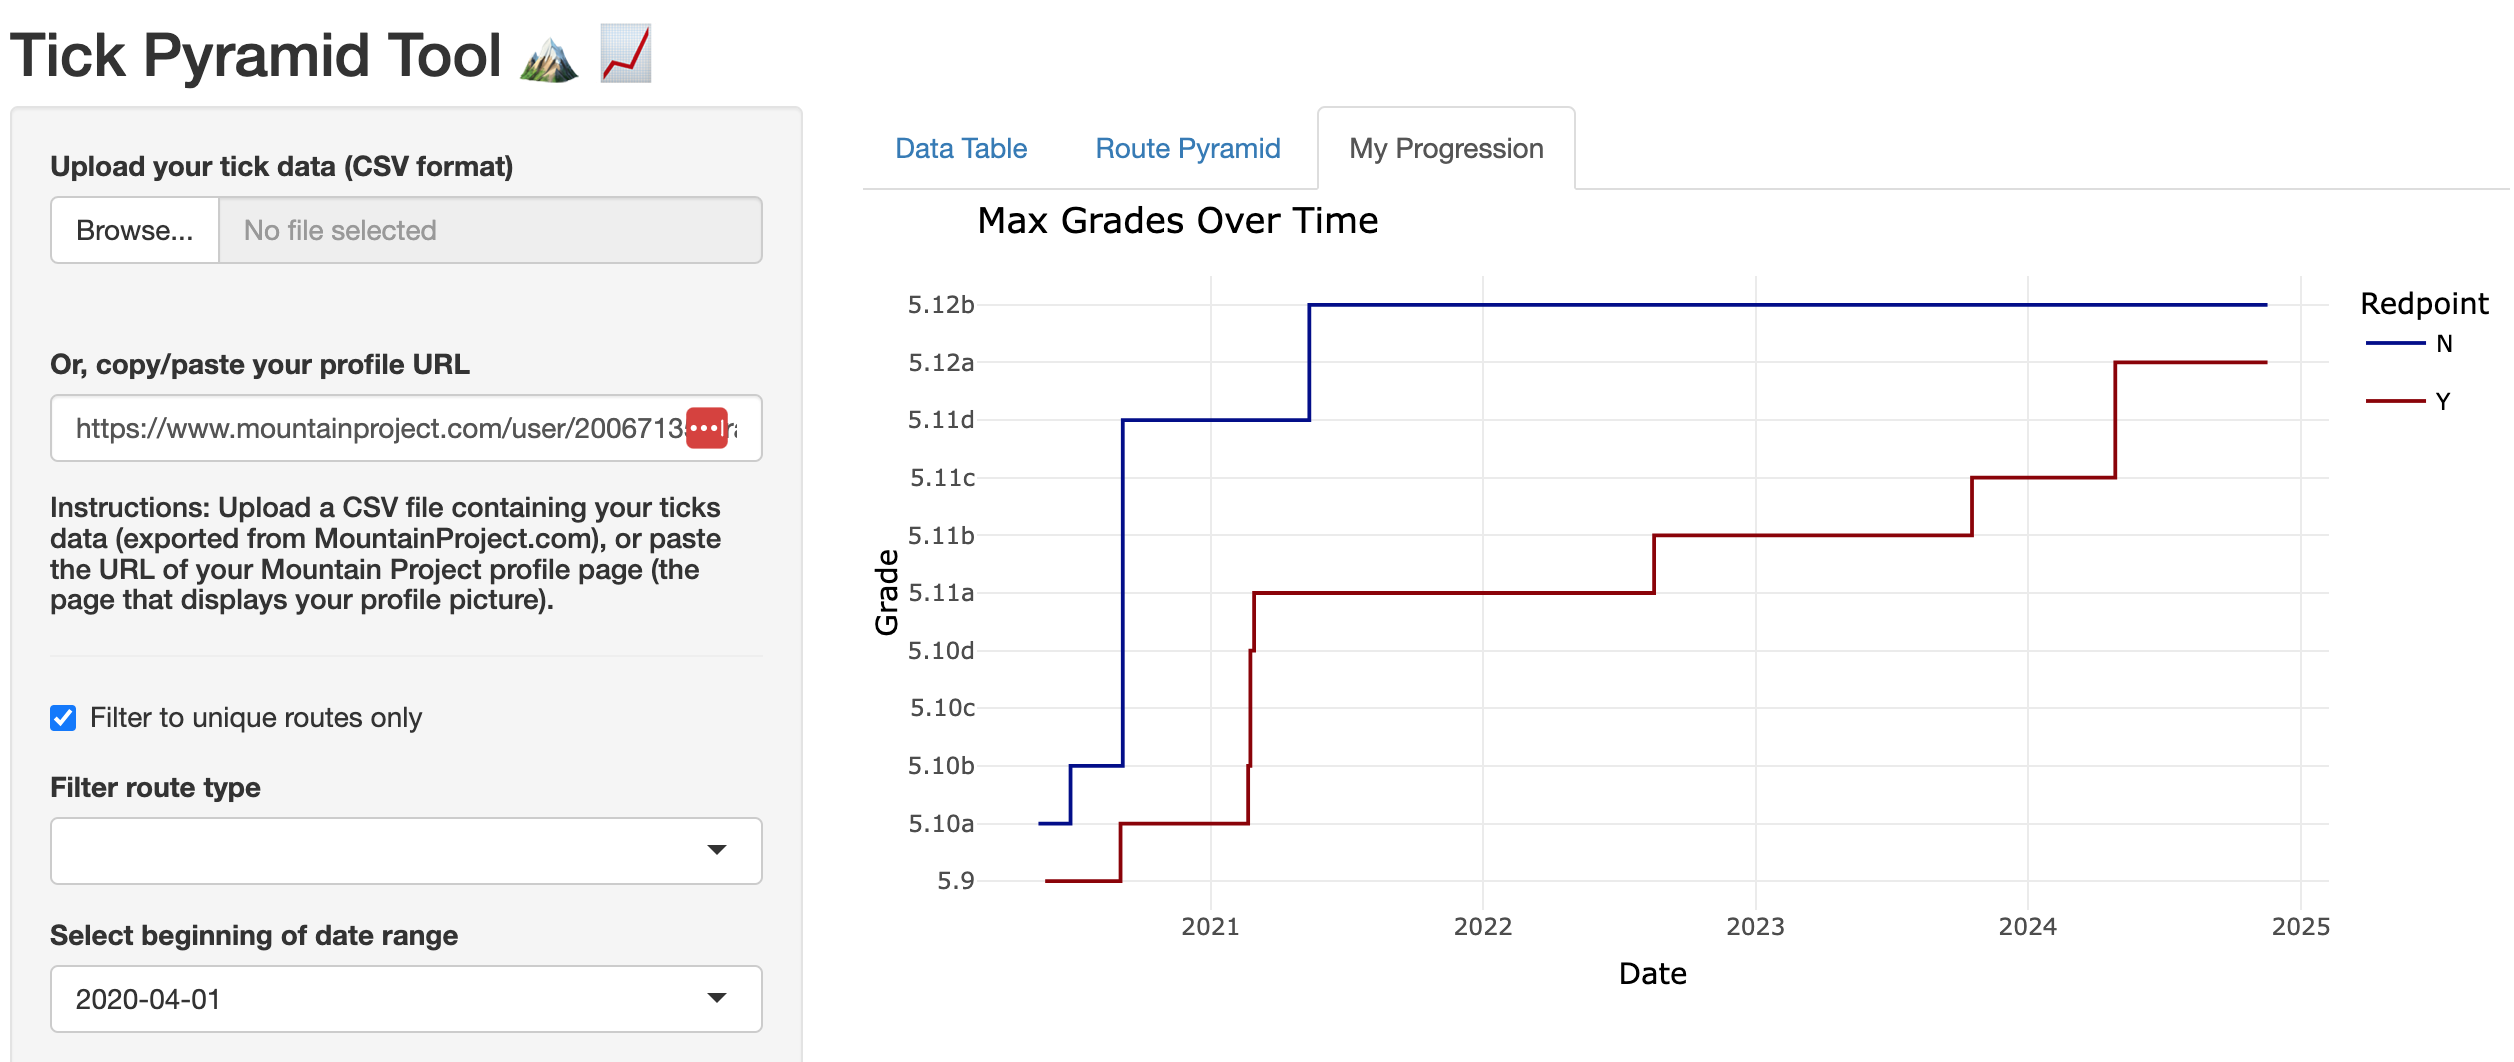
Using the very handy Shiny2 package for R, I developed a web application called the ‘Tick Pyramid Tool’ (subject to name change), which enables Mountain Project users to easily visualize their own climbing pyramids, just as I showed above. I also added the ability to view your progression over time, which simply tracks how your max grade has increased (hopefully by a lot!) since you started climbing.

This is an active work-in-progress and I plan to add more features to the web app as I solicit feedback from other climbers. However, I figured it is worth highlighting some of the key features in this ‘beta’ version:
- Users can upload their own ticks (from MountainProject.com) or paste their profile URL.
- See a complete list of all the climbs you’ve logged, and apply filters for route type, dates, and whether you want to include repeated ascents of the same route.
- Visualize your route pyramid (click the second tab across the top, or scroll down on mobile).
- Visualize your climbing progression over time.
If you are an R programmer and would like to contribute to the development of this tool, then I welcome you to fork the development branch on GitHub3.